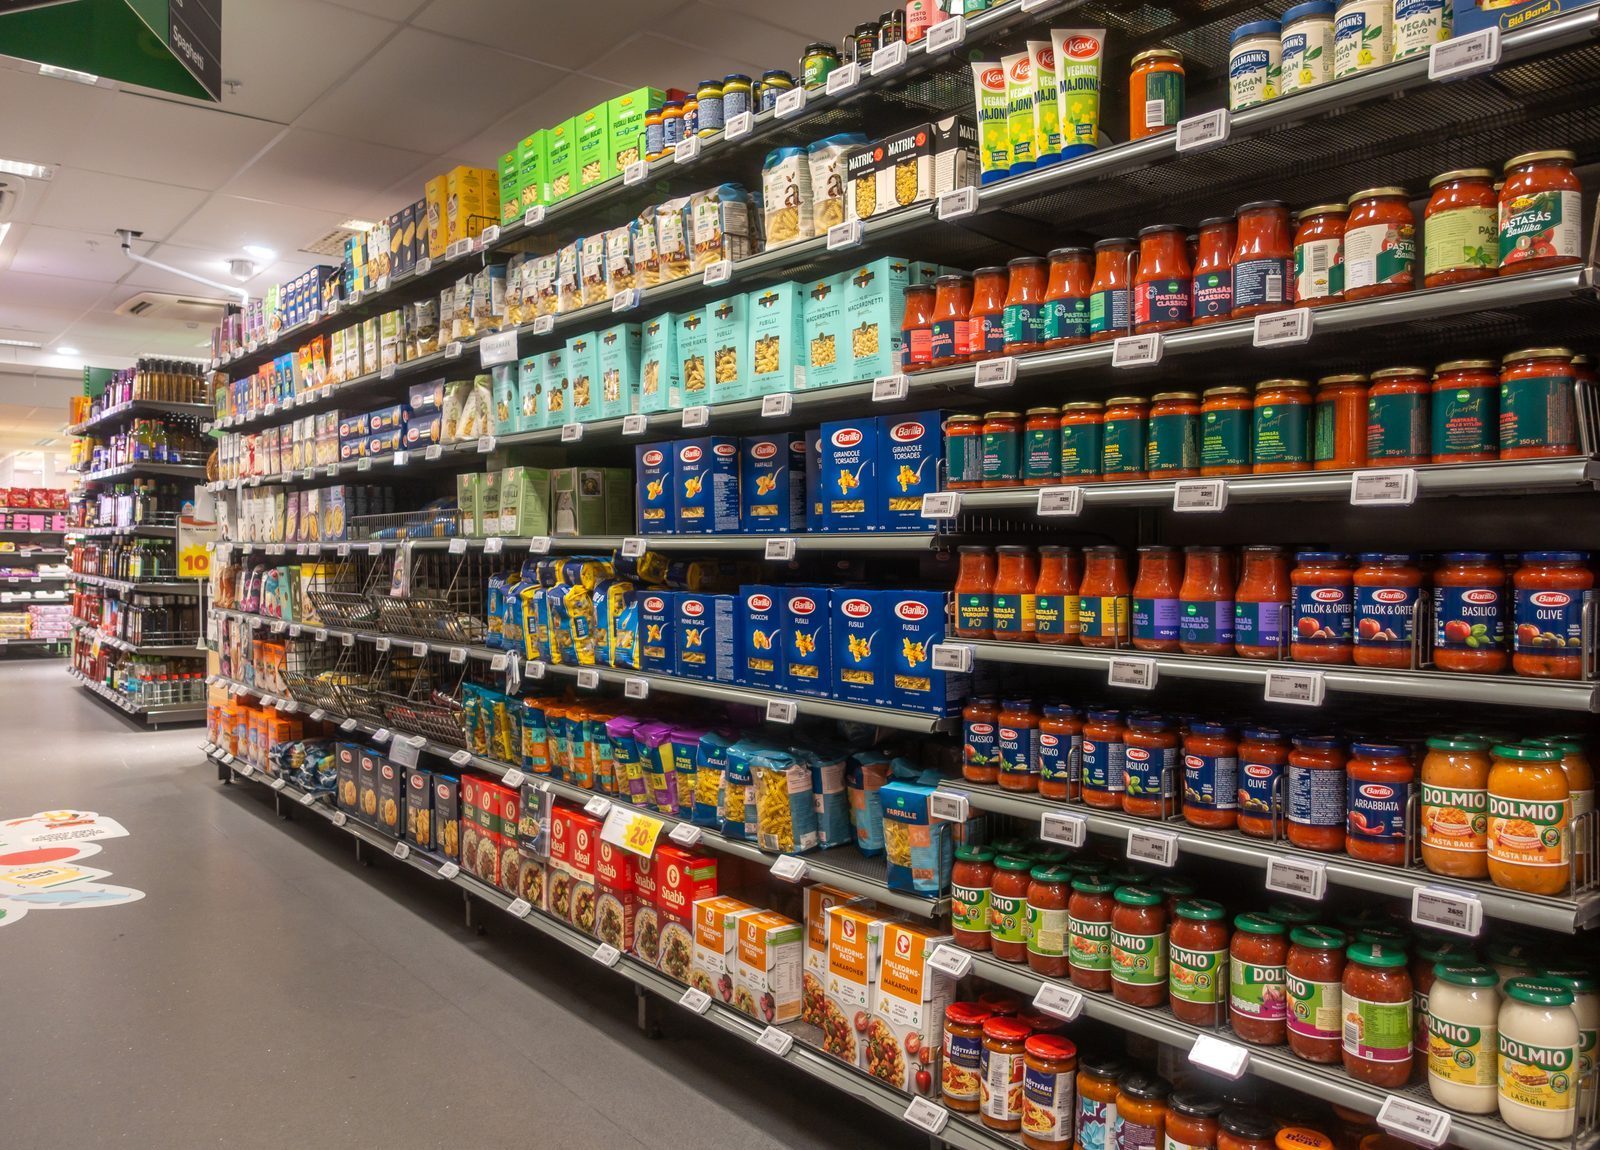
Tariffs add measurable inflation in summer
Import-exposed goods such as video equipment and floor coverings posted record price jumps in June 2025.
Key facts
- Video equipment up 4.5% in June; floor coverings up 4.2%
- Appliance prices up 1.9% in June 2025, most since Aug 2020
- Coffee prices up 18.9% in the 12 months to Sept 2025 (BLS)
Summary
By summer 2025, prices for a range of import-exposed goods were rising as businesses passed higher import costs on to consumers, CNN reported from BLS data: video equipment prices rose a record 4.5% in June, window and floor coverings a record 4.2%, appliances 1.9% (the largest monthly jump since August 2020), and apparel 0.4%.
What happened
The overall CPI rose 2.7% in the 12 months ending July 2025, with the gasoline index down 9.5% over the year (BLS). Individual import-exposed categories showed sharper increases: toys rose 1.4% in both May and June 2025, sporting goods 1.4% in June, and appliances 1.9% in June. Coffee prices rose 18.9% in the 12 months ending September 2025 (BLS); CNN noted coffee was among categories expected to feel added price pressure from tariffs.
Impact on the United States
American families paid more for electronics, clothing, furniture, appliances, and food. Tariffs disproportionately burdened lower-income households, which spend a higher share of income on goods. Yale Budget Lab (July 30, 2025) estimated the bottom income decile faced an average annual cost of ~$1,300 versus ~$5,000 for the top decile from all 2025 tariffs - a larger share of income for the bottom decile (3.5% versus 1.0%).
Documented effects
- Video equipment prices surged a record 4.5% in June 2025; windows and floor coverings rose a record 4.2% in June.[1]
- Appliance prices rose 1.9% in June 2025, the largest monthly jump since August 2020, after the administration extended 50% steel and aluminum tariffs to appliances and other "derivative products".[1]
- Coffee prices rose 18.9% in the 12 months ending September 2025 (BLS); CNN noted coffee was among categories expected to feel added price pressure from tariffs.[3][1]
- BLS: consumer prices rose 3.4% in the 12 months ending August 2026, driven mainly by energy (+16.3%) amid the Iran-war oil shock rather than tariffs; core prices (excluding food and energy) rose 2.4% and apparel 3.6%.[6]
Why this is rated significant
Import-exposed goods posted record monthly price increases in summer 2025 as businesses passed on higher import costs (CNN, from BLS data), a real broad cost though modest in percentage-point terms.
Corrections & updates [7]
Every change to a fact on this page after publication is logged here, newest first.
- CorrectedFigure
The summary said clothing prices rose 1% in June 2025; the cited CNN report says apparel prices rose 0.4% in June. The coffee effect was cited to an NPR article that does not mention coffee; BLS reports coffee prices up 18.9% in the 12 months ending September 2025. The July 2025 2.7% CPI figure is now cited to BLS.[1][3][4]
- CorrectedFigure
The entry attributed to the Yale Budget Lab a bottom-decile cost of ~$517 versus ~$2,175 for top earners, with no citation. The Yale Budget Lab report of July 30, 2025 gives average annual costs of $1,300 for the bottom decile and $5,000 for the top decile from all 2025 tariffs (short run, 2025 dollars).[5]
+ Show previous and current text- Hide previous and current text
- Previously
- American families paid more for electronics, clothing, furniture, appliances, and food. Tariffs disproportionately burdened lower-income households, which spend a higher share of income on goods. Yale Budget Lab estimated the bottom income decile faced an average annual cost of ~$517 versus ~$2,175 for top earners from all 2025 tariffs.
- Now
- American families paid more for electronics, clothing, furniture, appliances, and food. Tariffs disproportionately burdened lower-income households, which spend a higher share of income on goods. Yale Budget Lab (July 30, 2025) estimated the bottom income decile faced an average annual cost of ~$1,300 versus ~$5,000 for the top decile from all 2025 tariffs - a larger share of income for the bottom decile (3.5% versus 1.0%).
- CorrectedFigure
The summary text gave a $517 annual bottom-decile cost from Yale Budget Lab, with no citation. The Yale Budget Lab report of July 30, 2025 gives $1,300 for the bottom decile (short run, 2025 dollars, all 2025 tariffs).[5]
+ Show previous and current text- Hide previous and current text
- Previously
- BLS data showed sharp tariff-driven price increases in electronics, clothing, and home goods. Low-income households bore a proportionally higher burden; Yale Budget Lab estimated a $517 annual cost for the bottom income decile.
- Now
- BLS data showed sharp tariff-driven price increases in electronics, clothing, and home goods. Low-income households bore a proportionally higher burden; Yale Budget Lab estimated a $1,300 annual cost for the bottom income decile from all 2025 tariffs.
- UpdatedKey facts
Updated with the latest BLS data: consumer prices rose 3.4% in the 12 months ending August 2026, driven mainly by energy (+16.3%) during the Iran war; core prices rose 2.4% and apparel 3.6%. The headline rise is not attributed to tariffs.[6]
- CorrectedFigure
Several figures had no support in the cited sources: that tariffs added about 0.7 percentage points to CPI "by August 2025" (cited to a July 15, 2025 CNN article, which contains no such estimate), that imported goods prices rose about 4.0% vs 2.0% for domestic goods from March to September 2025, and the attribution of that estimate to the Harvard Business School Pricing Lab. They are removed. Replacement figures come from the cited CNN article (appliance prices up 1.9% in June 2025, the largest monthly jump since August 2020) and BLS (all-items CPI up 2.7% in the 12 months to July 2025, with gasoline down 9.5%; coffee up 18.9% in the 12 months to September 2025).[1][3][4]
- ClarifiedSeverity rationale
The severity rationale stated as fact that tariffs 'added a measurable inflationary layer'; it now attributes the link to the cited reporting. Severity unchanged.
+ Show previous and current text- Hide previous and current text
- Previously
- Tariffs added a measurable inflationary layer eroding household purchasing power, a real broad cost though modest in percentage-point terms.
- Now
- Import-exposed goods posted record monthly price increases in summer 2025 as businesses passed on higher import costs (CNN, from BLS data), a real broad cost though modest in percentage-point terms.
- CorrectedDisplay copy
The summary said BLS data showed 'sharp tariff-driven price increases in electronics, clothing, and home goods'; BLS does not attribute price changes to tariffs, and apparel rose 0.4%. The summary now gives the record's figures and attributes the tariff link to CNN.[1][5]
+ Show previous and current text- Hide previous and current text
- Previously
- BLS data showed sharp tariff-driven price increases in electronics, clothing, and home goods. Low-income households bore a proportionally higher burden; Yale Budget Lab estimated a $1,300 annual cost for the bottom income decile from all 2025 tariffs.
- Now
- BLS data showed record monthly price increases in June 2025 for import-exposed goods such as video equipment and floor coverings, which CNN linked to businesses passing on higher import costs. Yale Budget Lab estimated all 2025 tariffs would cost the bottom income decile about $1,300 a year, a larger share of income than for the top decile.
Sources [6]
- T2CNN Business - Here's how Trump's tariffs could be impacting prices for US consumers · Jul 15, 2025 ↗
- T2NPR - Inflation heats up in June as President Trump's tariffs start to bite · Jul 15, 2025 ↗
- T1U.S. Bureau of Labor Statistics - Consumer Price Index - September 2025 · Oct 24, 2025 ↗
- T1U.S. Bureau of Labor Statistics - Consumer Price Index - July 2025 · Aug 12, 2025 ↗
- T3Yale Budget Lab - State of U.S. Tariffs: July 30, 2025 (archived copy) · Jul 30, 2025 ↗
- T1U.S. Bureau of Labor Statistics - Consumer Price Index - August 2026 · Sep 11, 2026 ↗
Image: Frankie Fouganthin, CC BY-SA 4.0 (Wikimedia Commons)